Forum Discussion

 Contributor
Ashling RISC Free IDE fails to download ELF file
Hello ALTERA NIOSV Experts,
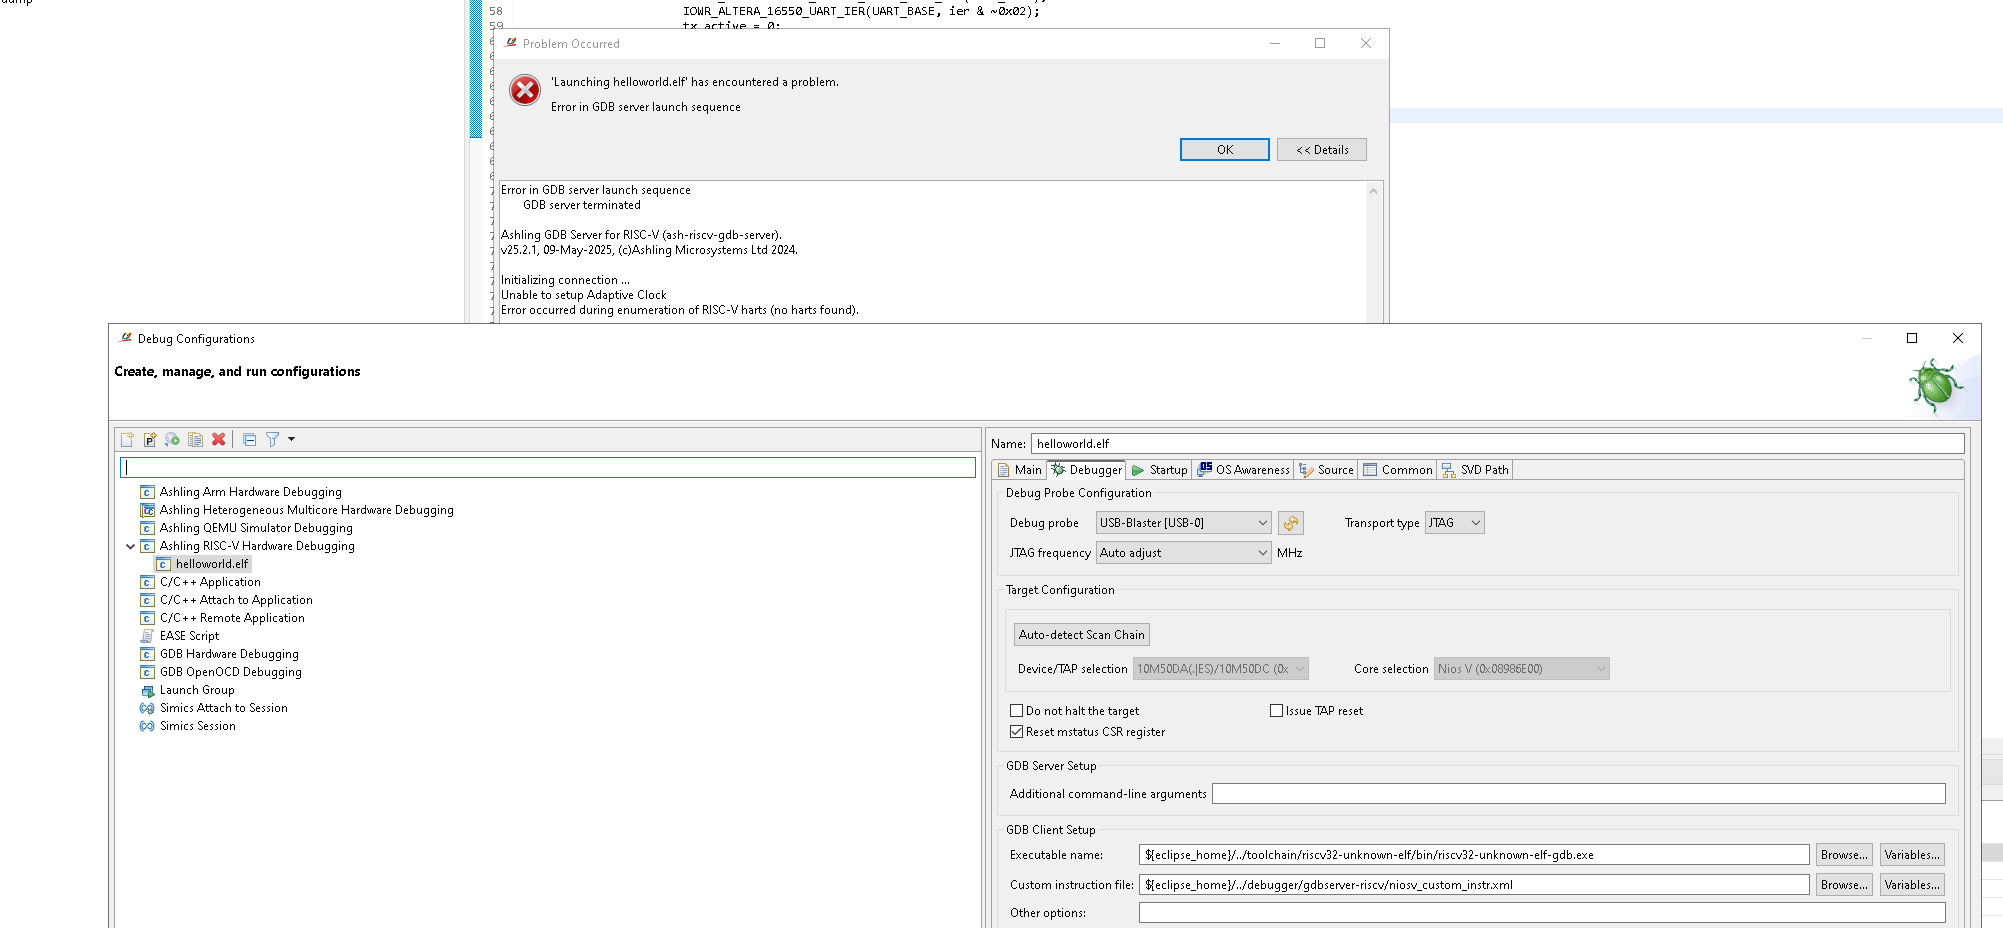
I have been trying to execute an application using a NIOSV CPU with the Ashling RISC Free IDE. The problem is that when trying to download the elf file to a MAX10 ALTERA Development board i see an error message saying that the AShling IDE cannot determine the JTAG clock speed.
I have added a Screen shot showing this event. Can anyone please suggest a solution to try ? I am currently using an ALTERA USB Blaster to connect but i have just ordered a USB Blaster II as i believe that can connect at faster clock speeds and is also more reliable.
Thanks for any help,
14 Replies
 Rejeesh_Ashling
New Contributor
Hi,
It seems 'Auto adjust' of JTAG frequency is not working in this case. Could you try changing the 'JTAG Frequency' field in the launch configuration to any other value like 16Mhz and check the behaviour?
Regards,
Rejeesh
 drbarryh
Hi Rajesh,
Thanks for the reply to my CASE. Actually i have tried many different speed settings , 1,4,16,24 MHz and they all failed with the same error message. It seems like the Ashling RISC IDE is blocked somehow from accessing the JTAG channel. I have no idea why that might be. Have you used this Ashling RISC IDE before and got it to work ?
I am running my design on a windows 10 PC.Thanks, Dr Barry H
- Rejeesh_Ashling
Hi Dr Barry H,
Given that 'Auto-detect Scan Chain' is working well, JTAG access is not broken. A second look at the error message suggests Ashling RiscFree is unable to communicate with the Nios V core, which can happen if the core is the being held in reset state (or otherwise not running/responding).
To further analyse the issue, could you please collect and share the following:
1. Share low level probe logging file generated by Ashling RiscFree:
In the 'Debugger' tab of the launch configuration, add the following to 'Additional command-line arguments' field.
--probe-log-level 7 --probe-log-path <path\to\store\log\file>Then re-launch the debug session. A log file (*.bin) should be generated at the specified location; please share that file.
2. Share 'jtagconfig' output:
From the Nios V shell, please run:
jtagconfig -d…and share the full output.
Regards,
Rejeesh
- drbarryh
Hello Rajeesh,
Thanks for the extra help. I will try this out. I Have discovered one problem was that the Windows 10 PC i was working with had Norton 360 AV installed, and even though it never reported any blocking events, ad all logs appeared to suggest it was not interfering with the debugger and Compiler, i must have been doing something., because today i uninstalled it all, rebooted, and tried running the debugger again, and it got a lot further:
Here is the log now :Ashling GDB Server for RISC-V (ash-riscv-gdb-server).
v25.2.1, 09-May-2025, (c)Ashling Microsystems Ltd 2024.
Initializing connection ...
Unable to setup Adaptive Clock
Connected to target device with IDCODE 0x31050dd using USB-Blaster-2 (2) via JTAG at adaptive speed.
Info : Active Harts Detected : 1
Info : Core[0] Hart[0] halted
Info : [0] System architecture : RV32
Info : [0] Debug version : v1.00
Info : [0] Number of hardware breakpoints available : 1
Info : [0] Number of program buffers: 8
Info : [0] Number of data registers: 2
Info : [0] Memory access -> Program buffer
Info : [0] Memory access -> Abstract access memory
Info : [0] CSR & FP Register access -> Abstract commands
Waiting for debugger connection on port 63780.
Press 'Q' to Quit.
Got a debugger connection from 127.0.0.1 on port 63780.
Then from the Debug Terminal i see this and it crashes:
GNU gdb (GDB) 13.2
Copyright (C) 2023 Free Software Foundation, Inc.
License GPLv3+: GNU GPL version 3 or later <http://gnu.org/licenses/gpl.html>
This is free software: you are free to change and redistribute it.
There is NO WARRANTY, to the extent permitted by law.
Type "show copying" and "show warranty" for details.
This GDB was configured as "--host=x86_64-w64-mingw32 --target=riscv32-unknown-elf".
Type "show configuration" for configuration details.
For bug reporting instructions, please see:
<https://www.gnu.org/software/gdb/bugs/>.
Find the GDB manual and other documentation resources online at:
<http://www.gnu.org/software/gdb/documentation/>.
For help, type "help".
Type "apropos word" to search for commands related to "word".
Warning: Instruction specification contains imm field
Warning: Instruction specification contains imm field
Warning: Instruction specification contains imm field
...Then it crashes ...ends up here :
void break_operation (void) {
#ifdef ALT_CPU_HAS_DEBUG_STUB
NIOSV_EBREAK();
#else // ALT_CPU_HAS_DEBUG_STUB
while(1) ;
#endif // ALT_CPU_HAS_DEBUG_STUB
}
Main never opens.....i assume something in the build went wrong but not sure what or why because it seemed to build OK.
LINUX BUILDS: I have also tried building your designs on my UBUNUT PC, and after doing all the configurations for the linux tools and the environment setup, get the following error messages from the Ashling IDE, i assume something is still not quite right in the Linux project configuartion, how do i tell it where the CMakecache.txt file is please ?:
Compile log from Ubuntu 24.04:
Description Resource Path Location Type
File CMakeCache.txt does not exist, unable to build project bsp CMakecache.txt Problem could not load cache bsp C/C++ Problem
Project 'bsp' has no explicit encoding set bsp /bsp No explicit project encoding
Project 'app_iperf' has no explicit encoding set app_iperf /app_iperf No explicit project encoding
File '/home/drbarryh/VAREX_Projects/25.1std_max10_package/software/bsp/build/default/compile_commands.json' was not created in the build. Your workbench will not know all include paths and preprocessor defines. bsp org.eclipse.cdt.jsoncdb.core.CompileCommandsJsonParser JSON compilation database
Thanks, Dr Barry H
- drbarryh
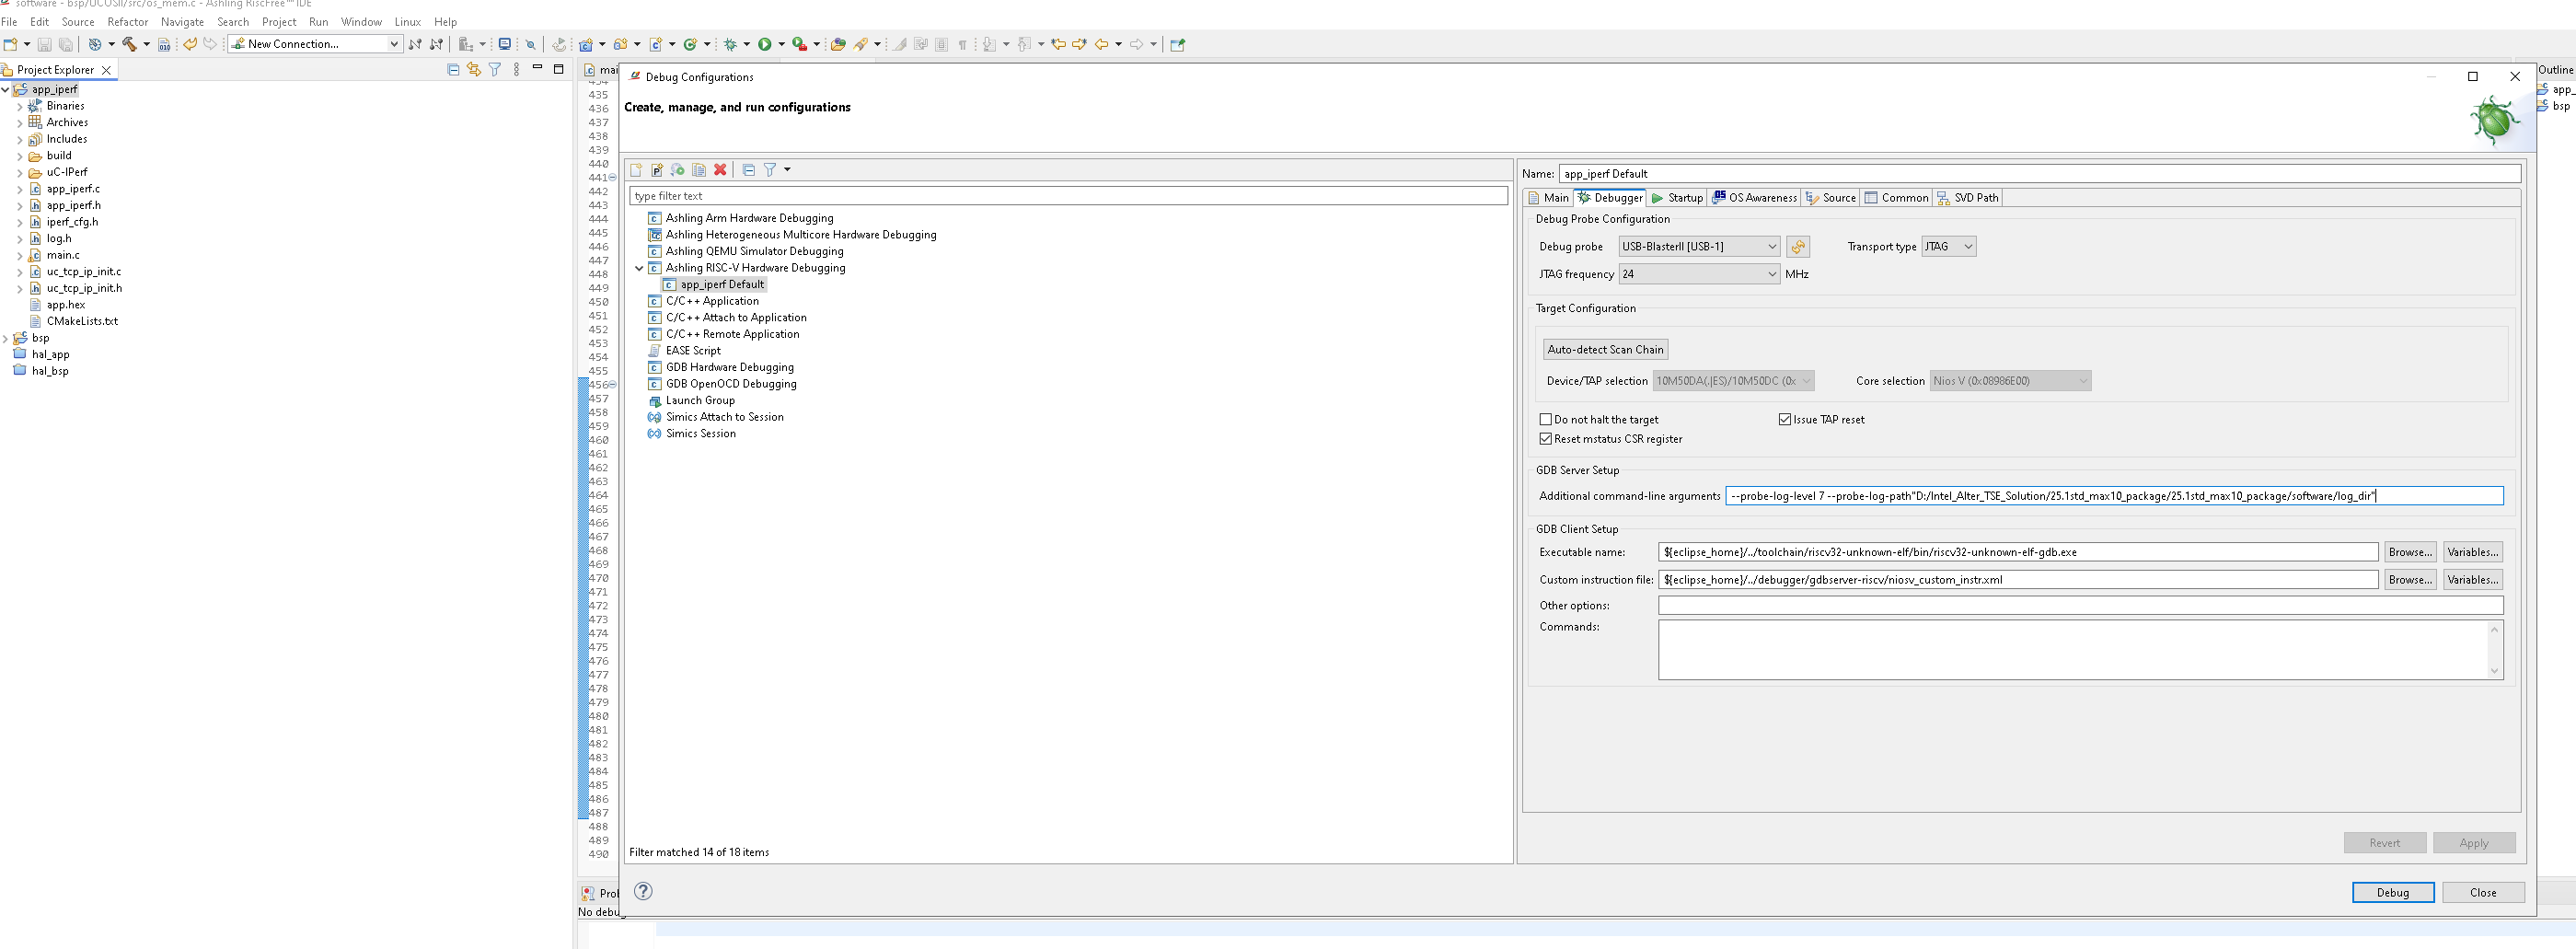
Hi Rajeesh, I was trying to follow your instructions for generating a level 7 log file but i got an error message and the gdb failed to run. Here is the exact command line i put in the In the 'Debugger' tab of the launch configuration, in the 'Additional command-line arguments' field. The Directory D:/Intel_Alter_TSE_Solution/25.1std_max10_package/25.1std_max10_package/software/log_dir does exist, i created it myself ::
--probe-log-level 7 --probe-log-path "D:/Intel_Alter_TSE_Solution/25.1std_max10_package/25.1std_max10_package/software/log_dir"
Error in GDB server launch sequence
Ashling GDB Server for RISC-V (ash-riscv-gdb-server).
v25.2.1, 09-May-2025, (c)Ashling Microsystems Ltd 2024.
Setting probe log level to 0x7.
Error: Error: Cannot open probe log file in specified/default directory: d:\intel_alter_tse_solution\25.1std_max10_package\25.1std_max10_package\software
Ashling GDB Server for RISC-V (ash-riscv-gdb-server).
v25.2.1, 09-May-2025, (c)Ashling Microsystems Ltd 2024.
Setting probe log level to 0x7.
Error: Error: Cannot open probe log file in specified/default directory: d:\intel_alter_tse_solution\25.1std_max10_package\25.1std_max10_package\software
I have attached a screenshot which shows the debugger setup page
Can you please take a look and see what the problem is here ?
Thanks, Dr Barry H
- drbarryh
Hi Rajessh,
I have a couple of questions to ask you about the MAX10 designs.
Q1: Am i intended to use the tcl script bsp_script_original.tcl which is located here: \25.1std_max10_package\software to build an Ashling IDE project from scratch ?
If yes would i run it from the Software Directory in a NIOSV console ?
Q2: During sending this command : $ niosv-download -g -r software/app_iperf/build/app_iperf.elf -c 1
I see the following suspicious looking messages:
INFO: Starting gdb. Running "riscv32-unknown-elf-gdb -batch -ex set non-stop on -ex set arch riscv:rv32 -ex set remotetimeout 60 -ex target extended-remote localhost:64265 -ex monitor swreset 1 1 -ex load software/app_iperf/build/app_iperf.elf -ex set $mstatus &= ~(0x00000088) -ex continue&".
The target architecture is set to "riscv:rv32".
warning: No executable has been specified and target does not support
determining executable automatically. Try using the "file" command.
warning: No executable has been specified and target does not support
determining executable automatically. Try using the "file" command.
Program received signal SIGINT, Interrupt.
0x00000004 in ?? ()
Invalid reset option
Are these messages (in bold) meant to be there and the NIOSV CPU can recover from the SIGINT and this invalid reset option and the warning about the missing executable file ? I am not that familiar with this flow so can you explain what is going on please ?
Thanks, Dr Barry H
 LiangYuG_Altera
Hi Dr Barry H,
Q1: Am i intended to use the tcl script bsp_script_original.tcl which is located here: \25.1std_max10_package\software to build an Ashling IDE project from scratch ?
If yes would i run it from the Software Directory in a NIOSV console ?It is not mandatory, you can straight away use the provided bsp folder.
The bsp_script_original.tcl is needed only when you wished to generate a 2nd bsp folder.
(It will be exactly the same as the provided bsp folder, so this action is not mandatory.)Q2: During sending this command : $ niosv-download -g -r software/app_iperf/build/app_iperf.elf -c 1
Are these messages (in bold) meant to be there and the NIOSV CPU can recover from the SIGINT and this invalid reset option and the warning about the missing executable file ? I am not that familiar with this flow so can you explain what is going on please ?Starting from beginning,
warning: No executable has been specified and target does not support determining executable automatically. Try using the "file" command.
In a normal gdb debugging session, it is common to use "file" followed by "load" command. This is necessary for debugging session. On the other hand, the niosv-download is simplified to execute run session (load & run the ELF, debug is not included). Thus, the gdb "file" command is optimized away.
Program received signal SIGINT, Interrupt.
0x00000004 in ?? ()
Invalid reset optionThe Nios V processor can recover from the SIGINT & Invalid reset option.
The invalid reset option is benign, and you may ignore it.Regards,
Liang Yu
 Cloudscraper
This might be anectodal, but my experience with USB Blaster 1 has been that it was absolutely unable to make Ashling work correctly with it from the Ashling Riscfree VS Code extension. We had to resort to using an USB Blaster 2 and then everything got fixed.
I cannot confirm if the same applies to the full version of Ashling, but if you could try at least one test with the Blaster 2 version it would be extremely profitable.
- ponaudo
Hello,
I am facing the same issue. Were you able to resolve it by using the Blaster 2?
Best regards
- Rejeesh_Ashling
Hi,
The issue discuss both debug (which was related to antivirus) was and desing related items; could you brief the exact issue you are facing with USB Blaster II? Ashling RiscFree does support USB Blaster II and the debug should work.
Regards,
Rejeesh
- ponaudo
Hi Rajeesh,
Thank you for your fast reply.
I am currently using a USB Blaster I with Ashling RiscFree for Altera 25.3 and a Cyclone 10 GX FPGA. Programming the FPGA works without any problems.
The issue arises when I try to load the .elf to my NIOS V/m. I have the same "error in GDB launch sequence (no harts found)" and was wondering, if it is a blaster issue which may can be solved by using a USB Blaster II or III.
Best regards
- BoonBengT_Altera
Moderator
Hi ponaudo,
Just checking in, if issues are still persisting, please do let us know by posting a separate discussion and our support agent would be with you.
Hope that clarify
Best Wishes
BB