 New Contributor
RiscFree debugging fails after first debug
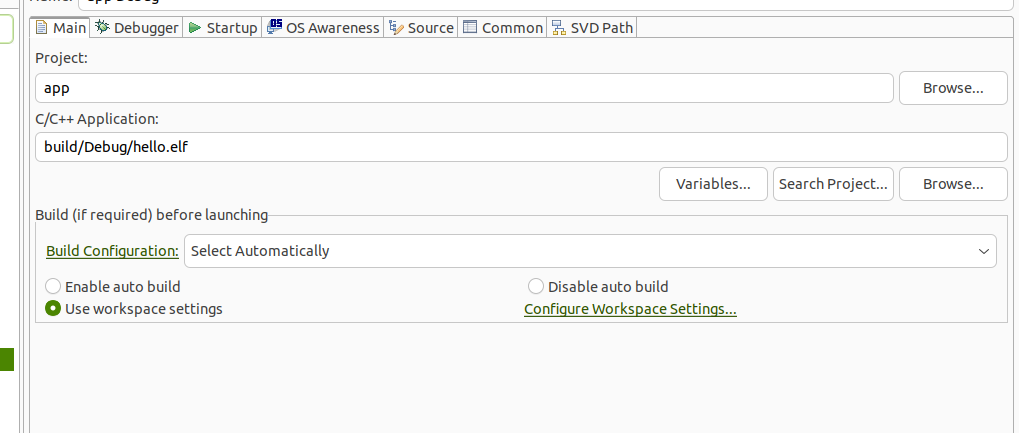
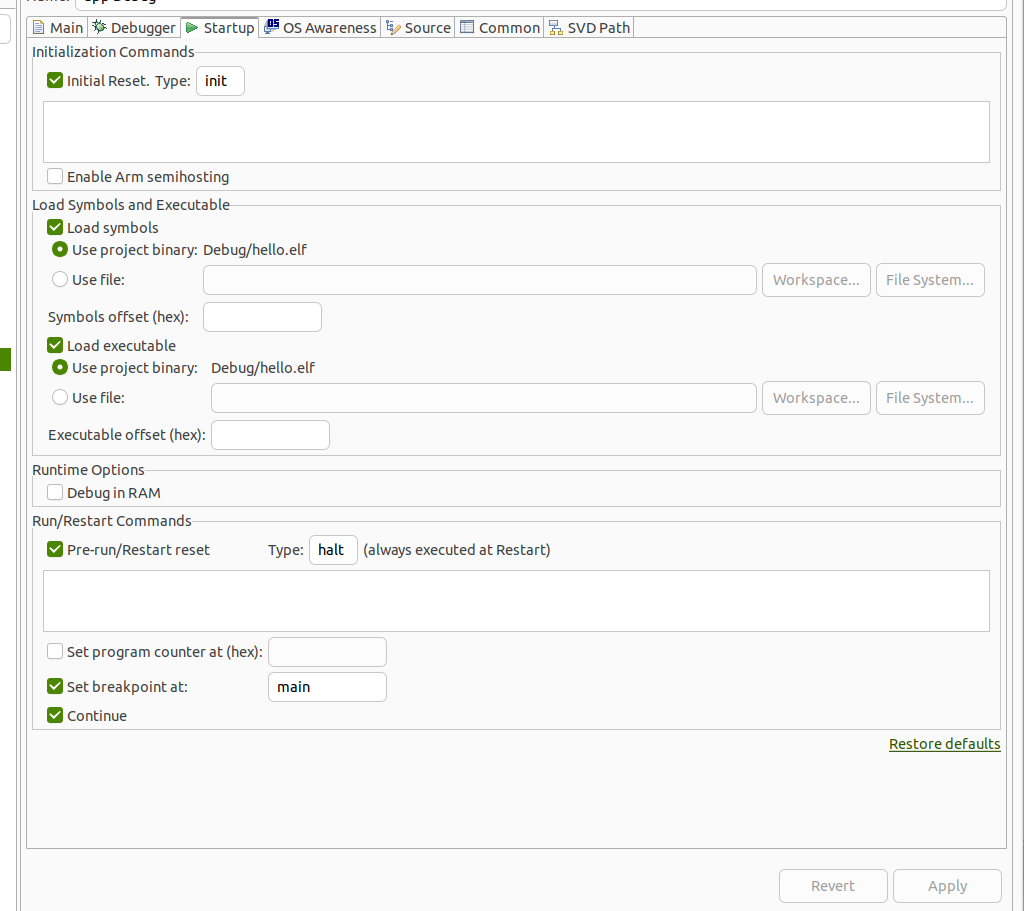
I have a simple Nios V system that prints "Hello World" on a DE-10. The design is generated using Quartus Std Lite 23.1.1. The first time I try to debug, everything is fine. The second time I try to debug, Ashling returns and error when a try and add a break point:
"Operation Failed: Command aborted"
Looking at the GDB output I get:
Warning:
Cannot insert breakpoint 1.
Cannot access memory at address 0x6a8
The only way I can recover is to program the .sof again, but it only works for one debug.
Is there anything that I can do because its annoying to have to program the SOF every time I want to debug?
Notes:
There is something strange in the at the ash-riscv-gdb-server output. On the first (successful) run it looks like:
Ashling GDB Server for RISC-V (ash-riscv-gdb-server).
v23.4.1, 03-Nov-2023, (c)Ashling Microsystems Ltd 2023.

Initializing connection ...
Checking for an active debug connection using the selected debug probe (SN: 1):
Connected to target device with IDCODE 0x2d020dd using USB-Blaster-2 via JTAG at 16.00MHz.
Info : Active Harts Detected : 1
Info : [0] System architecture : RV32
Info : [0] Number of hardware breakpoints available : 1
Info : [0] Number of program buffers: 8
Info : [0] Number of data registers: 2
Info : [0] Memory access -> Program buffer
Info : [0] Memory access -> Abstract access memory
Info : [0] CSR & FP Register access -> Abstract commands

Waiting for debugger connection on port 3333 for core 0.
Press 'Q' to Quit.
On the second (failed) an subsequent runs it looks like:
Ashling GDB Server for RISC-V (ash-riscv-gdb-server).
v23.4.1, 03-Nov-2023, (c)Ashling Microsystems Ltd 2023.

Initializing connection ...
Checking for an active debug connection using the selected debug probe (SN: 1):
Connected to target device with IDCODE 0x2d020dd using USB-Blaster-2 via JTAG at 16.00MHz.
Info : Active Harts Detected : 1
Info : [0] System architecture : RV32
Info : [0] Number of hardware breakpoints available : 1
Info : [0] Number of program buffers: 8
Info : [0] Number of data registers: 2
Info : [0] Memory access -> System bus (Data width : 128 Address size : 57)
Info : [0] Memory access -> Program buffer
Info : [0] Memory access -> Abstract access memory
Info : [0] CSR & FP Register access -> Abstract commands

Waiting for debugger connection on port 3333 for core 0.
Press 'Q' to Quit.
It looks like it has detected Memory access -> System bus (Data width : 128 Address size : 57) as a way to access memory. This seems strange because it didn't exist on the first run. Also the values for the width + address size are just wrong (and can change between runs).
This also happens if I use ash-riscv-gdb-server from the command line outside the RiscFree IDE. I have also tried using OpenOCD. It never fails. However, it causes ash-riscv-gdb-server to fail in the same way when its executed after OpenOCD.
Externally I was also able to debug multiple times provided I don't shutdown the ash-riscv-gdb-server. Everything starts failing when ash-riscv-gdb-server is re-run.
Hi
Sorry in that cause you will need to wait for the release of Quartus Standard 24.1 in Q1 next year.
Regards
Jingyang, Teh

