Forum Discussion

Altera_Forum Honored Contributor
13 years agoHonored Contributordft problem
greetings,
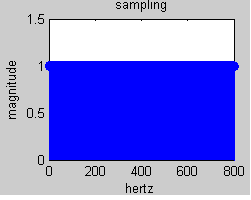
hi i have typed followin code to verify samplng theorem but the answer is coming something different.may i know the reason. clc; fs=800; t=0:1/fs:1 x=cos(2*pi*400*t); xm=(fft(x)); k=0:length(xm)-1; subplot(2,2,1); stem(k,xm) xlabel('hertz') ylabel('magnitude') title('sampling') the result should come at only one frequency(i.e one line at frequency of cosine) as the signal is cosine but spectrum is continious. why ? the spectrum (o/p)is attached here thanks in advance4 Replies
 Altera_Forum
You're doing:
t=0:1/fs:1 x=cos(2*pi*400*t); The step is 1/fs, which is 1/800 = 0.00125 This means, that from range 0 to 1, every 0.00125 step You'll get a new frequency (because argument 't' in cosine function is changing), that is: 800 results. So what do You expect in frequency domain to see?- Altera_Forum
your frequency is half sampling rate and is one line mirrored
plot(k,abs(xm)); - Altera_Forum--- Quote Start --- You're doing: t=0:1/fs:1 x=cos(2*pi*400*t); The step is 1/fs, which is 1/800 = 0.00125 This means, that from range 0 to 1, every 0.00125 step You'll get a new frequency (because argument 't' in cosine function is changing), that is: 800 results. So what do You expect in frequency domain to see? --- Quote End --- but my signal is cosine and the sampling rate is also twice of highest frequency ,so corresponding i must gate only two frequency component.
- Altera_Forum
But I told you you have got it. Just your plot is wrong.