Forum Discussion
Altera_Forum Honored Contributor
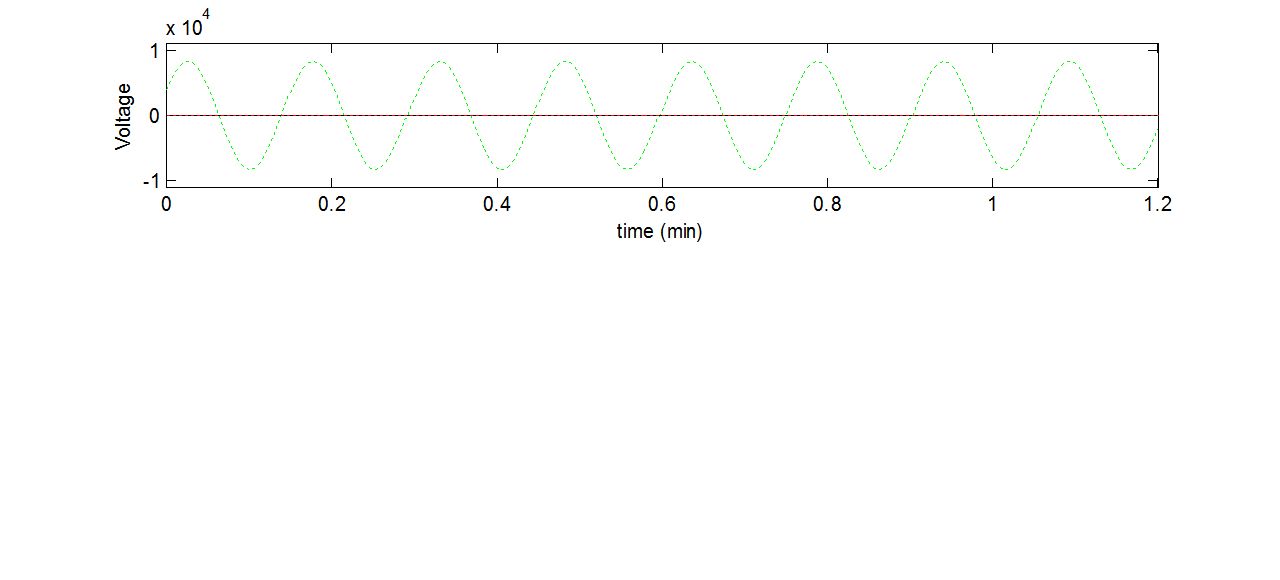
10 years agoHonored ContributorReceived waveform frequency is way too low than it was sent
I am using Quartus 12.1 sp1, vhdl and Altera Nios II programmed in C code for DE0-Nano Development. Basically, what I have is, data is sent from fpga vhdl block to NIos II system, Nios II system send...
Altera_ForumHonored Contributor
10 years agoHonored Contributor --- Quote Start --- your sine cycle is 100 data so if your sampling frequency(Fs) is regular and known then sine frequency = Fs/100 Nios/UART/Matlab will process data based on instruction time so time dimension is vague here (Fs in somewhat unknown unless samples are sent at regular intervals). If you are sending all samples (without loss or duplication) then scale the plotter according to Fs/100. It looks you have a plotter with fixed time scale. I think it is better you focus on samples being sent correctly than actually measuring frequency of sine. --- Quote End --- Thanks for your reply, i can get the amplitude of the samples sent correctly, the issue now is the frequency. Sorry, I still dont understand. What actually determine the period of the plotted waveform?