Forum Discussion
Altera_Forum Honored Contributor
10 years agoHonored ContributorReceived waveform frequency is way too low than it was sent
I am using Quartus 12.1 sp1, vhdl and Altera Nios II programmed in C code for DE0-Nano Development. Basically, what I have is, data is sent from fpga vhdl block to NIos II system, Nios II system send...
Altera_ForumHonored Contributor
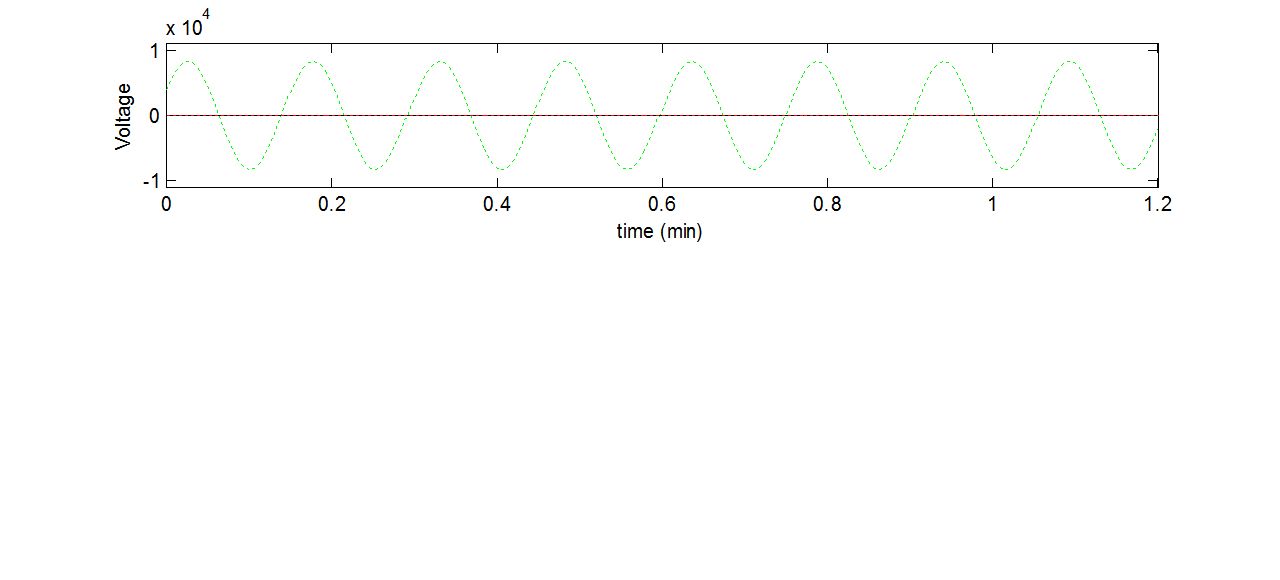
10 years agoHonored Contributor --- Quote Start --- You have many variables in your setup: 1) nios runs at known speed but your tone frequency depends on instructions (nios is no good as NCO) so your frequency at generation is unknown 2) buffering adds further time uncertainty 3) plotter needs to be scaled correctly but I don't think you can so with your given info it is not doable. --- Quote End --- Thank you kaz for your reply. Regarding point 1 and point 2, instead of getting Vref from fpga block, now I have the Vref data in C code (as below, just for testing), so I am no longer doing any buffering, still I obtain the same result where the period of a complete cycle of sinewave is 0.16 minutes. So, if I understand correctly, now the data is available in C code straightforward, so shouldn't I expect the data can be plotted faster? Regarding point 3, I don't understand how to scale the plotter.
float Vref = {0.00,0.06,0.13,0.19,0.25,0.31,0.37,0.43,0.48,0.54,0.59,0.64,0.68,0.73,0.77,0.81,0.84,0.88,0.90,0.93,0.95,0.97,0.98,0.99,1.00,1.00,1.00,0.99,0.98,0.97,0.95,0.93,0.90,0.88,0.84,0.81,0.77,0.73,0.68,0.64,0.59,0.54,0.48,0.43,0.37,0.31,0.25,0.19,0.13,0.06,0.00,-0.06,-0.13,-0.19,-0.25, -0.31, -0.37, -0.43, -0.48, -0.54, -0.59, -0.64, -0.68, -0.73, -0.77, -0.81, -0.84, -0.88, -0.90, -0.93, -0.95, -0.97, -0.98, -0.99, -1.00, -1.00, -1.00, -0.99, -0.98, -0.97, -0.95, -0.93, -0.90, -0.88, -0.84, -0.81, -0.77, -0.73, -0.68, -0.64, -0.59, -0.54, -0.48, -0.43, -0.37, -0.31, -0.25, -0.19, -0.13, -0.06};max_packets = 20000; %maximum number of packets to keep in memory (all are saved to log file)
update_plot = 1; %how often we should update the plot
plot_length = 12; %maximum length of plot
figure('Position', ); % new figure
ax1 = subplot(3,1,1); % top subplot
ax2 = subplot(3,1,2); % bottom subplot
ax3 = subplot(3,1,3);
drawnow;
s = serial(port);
cleanupObj = onCleanup(@()cleanupFunc(s)); %clean-up function
set(s,'BaudRate',115200,'timeout',2); %timeout is in seconds
fopen(s);
vref= NaN(12,max_packets);
j = 0;
tic; %start timer
while 1; %do forever...
%get data line by line
line = fscanf(s);
= disect_line(line);
if c == 1 %start recording from set 1
vref(1,j) = vo;
for i = 2:12 %get set 2 to 12
line = fscanf(s);
= disect_line(line);
if c == i
vref(i,j) = vo;
else
fprintf('\nError\n');
end
end
dlmwrite(logfile,,'delimiter',',','-append'); %save data from all 12 sets to csv file
plot(ax1, start:j, vref(1,start:j).');
for k = 1:1
text(j, vref(k, j), num2str(k), 'Parent', ax1);
end
xlim(ax1, );
ylabel(ax1, 'Vref');
title(ax1, );
end
end
function = disect_line(line)
c = str2double(line(1:2)); %set number
vo = str2double(line(4:7));
end
function cleanupFunc(s)
fprintf('\nClosed serial port.\n')
fclose(s);
delete(s);
clear s;
end