Forum Discussion

 Honored Contributor
Strange FFT Output
I've been using SignalTap to create a CSV file of the output from my FFT engine. However, when looking at the output in Matlab, it doesn't look right at all.
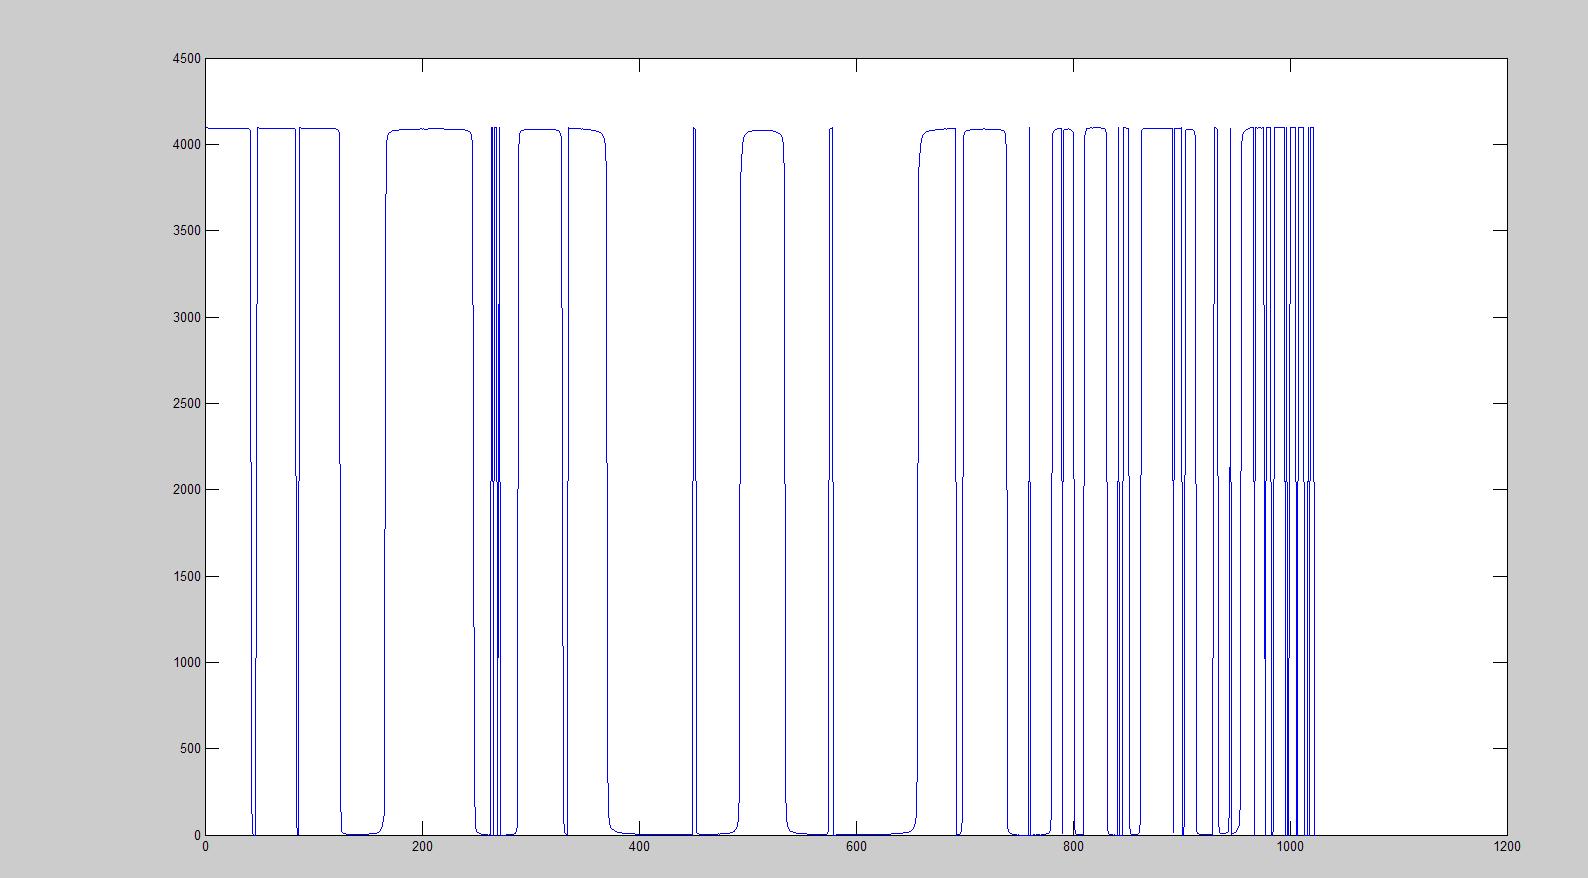
I know that the ADC's working properly, I'm sending in a 1kHz signal which looks perfect when plotted, so the FFT input is fine, but, the output is all over the place. Is there further processing I have to do on it to make it look like the Matlab example, or is there something going horribly wrong with my FFT core? I've attached the plot of the Real values coming out of the FFT, any thoughts?17 Replies
 Altera_Forum
As long as your matlab is giving you just the real and imaginary output of the FFT calculations the output should look very similar. If Matlab is giving you a Magnitude plot. You need to calculate the magnitude of the output. But looking at your "Real" output, it looks like something is broken.
Here's what I would check: 1: Check your warnings. Make sure the FFT core is finding the twiddle ROM files. (Sin/cos lookup tables). If it doesn't find these files, the outputs will be incorrect. 2: Make sure your Avalon streaming interface is working properly. (You should be able to check the "error" output and it should ALWAYS be zero. If this is not the case, the outputs will be incorrect. Here's some other general questions to answer that may help pinpoint the issue. What size of FFT are you running? (how many points?) What version of Quartus are you using? Was the FFT core generated with the same version of Quartus? Have you simulated the core? in Verilog/VHDL? Pete- Altera_Forum
Hi Anakha,
Thanks for this response, I'm taking a look at it now. Some info for you: 1024 point FFT Quartus v11.1 (FFT core generated in this version) I have simulated the core previously, but I have been unable to look at the output properly. Is there a way to get a csv file or something out of modelsim? I'm also now trying to generate a 1kHz wave in my testbench to simulate with, so I should have some results soon. Dave - Altera_Forum
Check the output order of your FFT samples. They may be in bit reversed order. Also, in simulation tools to can generate a .csv fairly easily by using $fwrite in verilog. I'm sure that VHDL has something similar.
- Altera_Forum
I've done a few simulations using $fwrite to capture the data, both in Natural and Bit Reversed orders, and the output is still incorrect. I've attached an example output at the bottom. The input for both of these examples is a 17.36Hz sine wave, generated in the Verilog testbench.
I know it's not a problem with the FFT engine, as running the testbench that is generated with the core gives exactly the same output as when run in Matlab. One thing I realised I was doing wrong previously, was using an unsigned integer as the input, something which I have now rectified. - Altera_Forum
Right, I've identified an error here. As I've mentioned before, the input to my FFT is a 12-bit signed value, and for some reason, when the value is negative, the whole rest of the word is populated with 1s rather than just the MSB. For example, the value 111111111010 is used to represent -6, rather than 100000000010.
I think this is causing the FFT to clip, and give me a really weird output. Any ideas why this would be happening? - Altera_Forum
It looks like you are doing something wrong with data formats or that your input entering the fft is not what you think. Have you actually captured digital vector entering fft core?
Matlab model cannot be right either if you are looking at fft of a single sine input. Finally, is your sampling rate correct? - Altera_Forum
the value -6 should be filled with ones. This is correct in 2's complement.
- Altera_Forum
Kaz,
Which sampling rate do you mean here? Further to my previous post, I've realised that the input I'm using is fine. It's in Two's Complement format, which is what the FFT requires. It's the magnitude data (sqrt(real^2+i^2)) that produces the graphs shown in post# 7, I know there's processing to be done further down the line, but that should give me a couple of peaks for a single sine input. - Altera_Forum
The question was: have you signaltapped the input itself and not just rely on analogue side. Your fft output is too weird to debug from graph.
Capture input and then use matlab fft to find output independent of core. By sampling I mean ADC sampling rate(actual clock rate that samples) and are you clocking fft with same rate. - Altera_Forum
I have signaltapped the input, yes. However, I can't get to my Sig Gen and such until Monday to do any more tests. As for the sample rate, I'm clocking at 6.25kHz, which is my downsampled ADC output.
I may have cracked it now, although I don't wan't to get my hopes up too much as it's always just one thing after another... I think the problem might be coming when I write to file in my testbench, it's writing out as an unsigned decimal. By converting it to signed, it's actually starting to look right. Any ideas on how to get my testbench to write to file as a signed int rather than unsigned?