Forum Discussion

 Occasional Contributor
SignalTap Logic Analyzer waveform display
 4 years ago
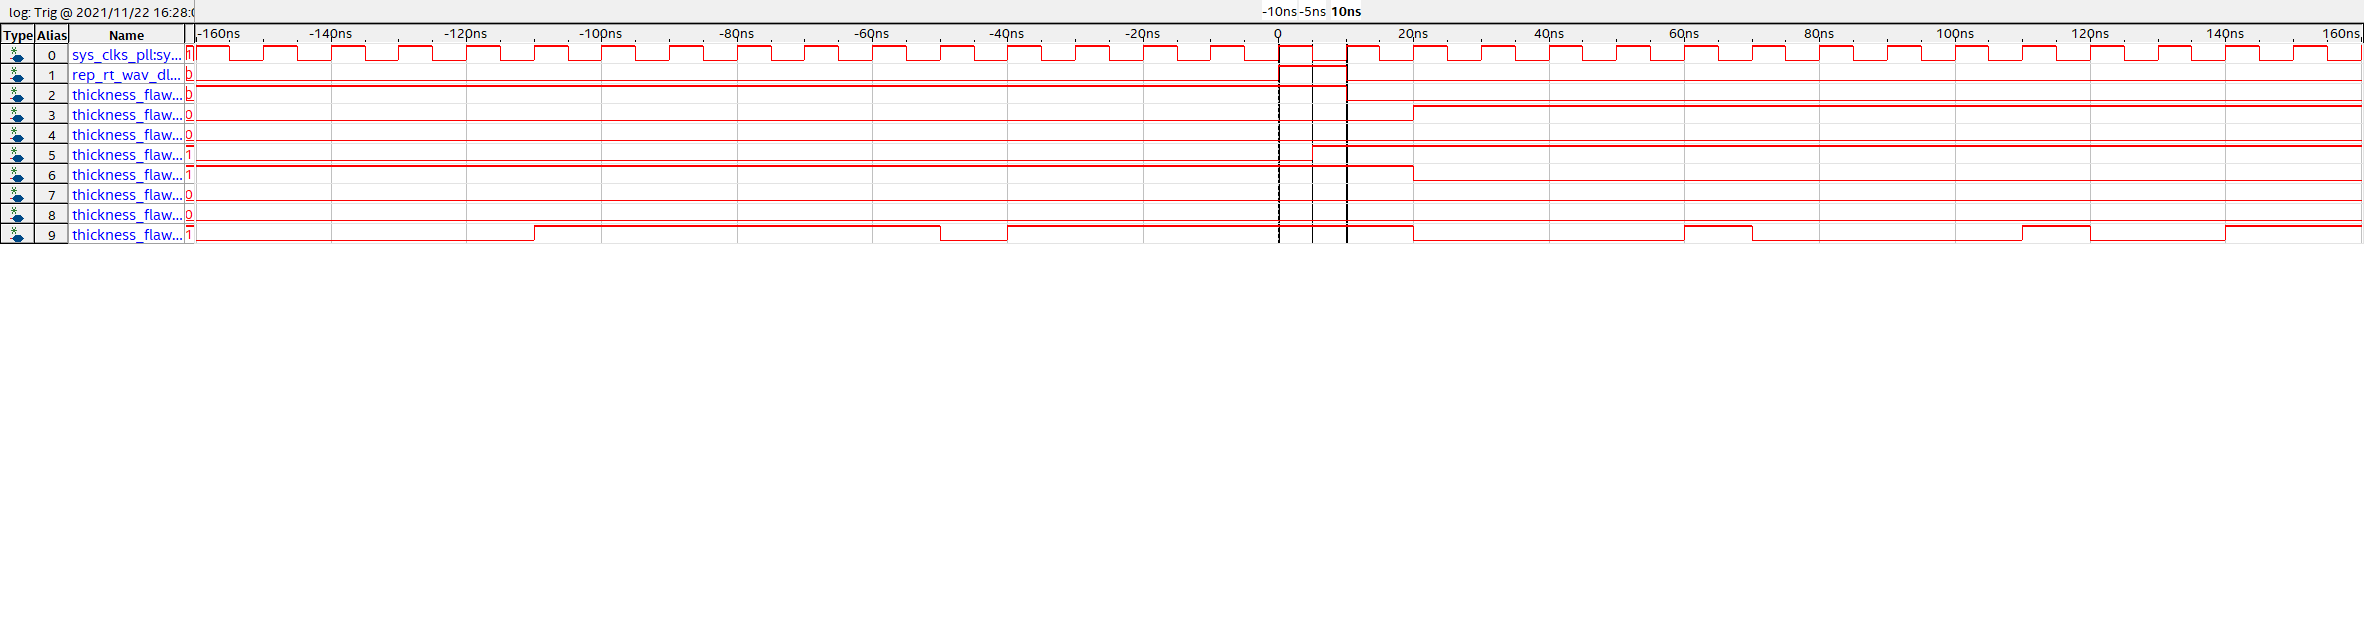
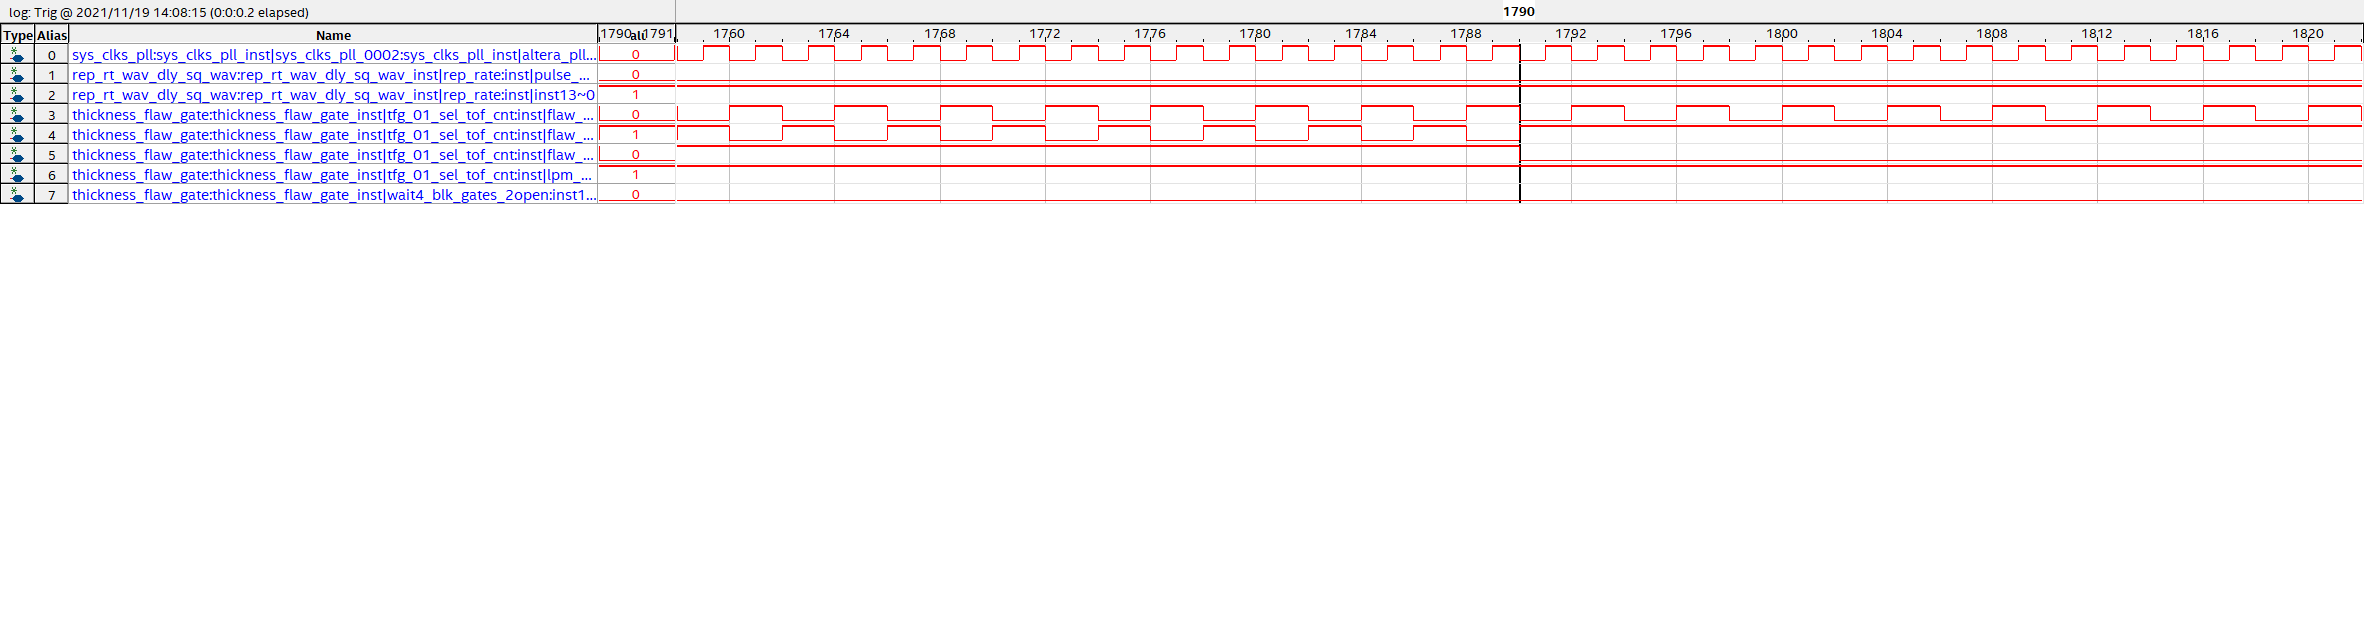
I made a new stp file. Prior to running an analysis I punched in numbers starting at 0 for the aliases. I use the signaltap text file to lift the signal names when I record the results of the analysis. When I ran the analysis the arrows magically appeared. I did not even add time bars.
I had been reusing the old stp file. I wonder if reusing the stp too many times confuses SignalTap. Should I be using a new stp file each time I want to add signals?
 Super Contributor
So you're saying you see the Value column but no arrows above it?
I click where it says "Click to insert a time bar" and the Value column and the arrows appear.
Occasional ContributorI made a new stp file. Prior to running an analysis I punched in numbers starting at 0 for the aliases. I use the signaltap text file to lift the signal names when I record the results of the analysis. When I ran the analysis the arrows magically appeared. I did not even add time bars.
I had been reusing the old stp file. I wonder if reusing the stp too many times confuses SignalTap. Should I be using a new stp file each time I want to add signals?